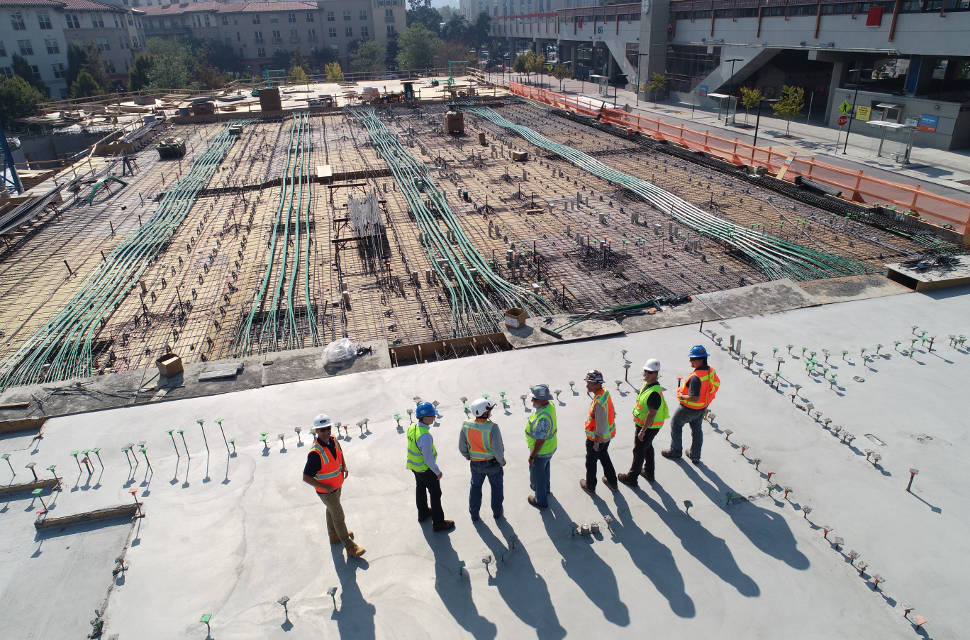
California Leads the Nation in Blue Collar Job Growth in October
The 20,859,000 blue collar jobs in the US in October were 13.9 percent of the total nonfarm jobs in the United States, up from 13.7 percent in October 2017. This was an increase of 67,000 jobs (0.3 percent) in construction, manufacturing and mining and logging since September. Since October of 2017, employment in these industries is up 691,000, a 3.4 percent increase. This is still 5.3 percent lower – 1,156,000 jobs — than the month immediately preceding the Great Recession.
Regionally, the largest gains were in the Pacific Census division, which added 16,100 blue collar jobs (0.5 percent increase for the month). This was followed by the Middle Atlantic division with 11,000 or 0.5 percent, and the South Atlantic division at 7,700 or 0.2 percent. The Industrial Midwest, the unofficial region sometimes known as the Rust Belt, added 17,700 blue collar jobs, a 0.3 percent increase. Employment growth in the region averaged 0.2 percent from September through October, slightly trailing the national average of 0.3 percent over the same period.
By state, California added the most blue collar jobs, at 9,800 a 0.4 percent increase. Pennsylvania added 5,400 (+0.6 percent) followed by Texas with 5,300 (+0.3 percent). A few states saw a significant loss in blue collar jobs on the month. Notable among these was Louisiana, which lost 2,000 jobs, a decrease of 0.6 percent, and Kansas, which lost 800 jobs (0.3 percent). Over the 12 months from October 2017 to October 2018, only Hawaii (-500 jobs or -1.0 percent) and Arkansas (-100 jobs or -0.2 percent) experienced a decrease in aggregate employment in the blue collar industries we track.
Construction
Turning specifically to construction, the nation added 30,000 jobs, an increase of 0.4 percent. The Pacific Census division added 6,700 jobs (+0.5 percent), and was only out-paced by the South Atlantic division, which saw an increase in employment of 7,800 or +0.5 percent. However, the larger South Census region was also home to the only decrease in construction employment, a fall off of 1,200 jobs (-0.1 percent) in the West South Central Division. The decrease in employment was primarily driven by a 1,900 (-1.3 percent) drop in Louisiana, the fifth consecutive month of job loss in the state. Michigan and Oklahoma each saw construction employment fall by 900 jobs, decreases of 0.5 and 1.1 percent respectively. Over the last 12 months, construction employment has fallen considerably in both New Jersey, (-3,800 or -2.5 percent) and in South Carolina (-1,700 or -1.7 percent).
Manufacturing
Nationally, manufacturing added 32,000 jobs, an increase of 0.3 percent. Regionally, only the West South Central Census division saw a decrease (-700 or -0.1 percent) in the number of manufacturing jobs. This was a result of job losses in all four states in the region led by Louisiana (-600 jobs or -0.4 percent), Texas (-500 jobs or -0.1 percent), Arkansas (-400 or -0.2 percent) and Oklahoma (-300 jobs, 0.2 percent). This may be an anomaly as the 3 month average increase in employment was 0.3 percent from August to October compared to 0.2 percent for the previous 3 months.
Other states had more significant manufacturing losses. The worst were in Georgia, which lost 1,700 jobs (-0.4 percent) and New York, which lost 900 jobs (-0.2 percent). Meanwhile, California added 6,600 jobs, an increase of 0.5 percent. This was followed by Pennsylvania at 3,000 jobs, or 0.5 percent, and New Jersey with an addition of 2,200 jobs (0.9 percent).
Though it only added 700 jobs in October, Nevada has seen large gains in manufacturing employment in the last few years. Over the last three months, growth has averaged 1.4 percent compared with the 0.2 percent national average. Nevada is one of the few states where manufacturing employment is currently above pre-recession levels (+7,400 jobs or 14.9 percent). Going back to 2000, it is one of six states where manufacturing employment has increased, having added 14,900 jobs an increase of 35.5 percent. This is followed by Utah (9,500 or 7.6 percent), North Dakota (2,200 or 9.5 percent), Idaho (1,000 or 1.4 percent), South Dakota (1000 or 2.3 percent) and Alaska (900 or 7.1 percent).
Mining
Mining and logging grew by 500 jobs in October, an increase of 0.7 percent. Jobs in the industry accounted for 2.8 percent of total nonfarm employment last month, five percentage points higher than in January of 2000 but is slightly lower than the 2.9 percentage of total nonfarm employment the industry accounted for before the recession. Jobs in coal were down 0.4 percent or 200 jobs nationally in October and down 0.2 percent compared with a year ago. Coal jobs were flat in Kentucky, Pennsylvania, and Wyoming, the three states in which the BLS tracks coal employment at the state level. As has been the trend for some time, support for mining and logging continues to drive growth in the industry. Since the end of the recession, support for mining and logging has added 100,200, an increase of 38 percent. This compares with an increase of 5,200 (15.3 percent) in metal ore mining and 8,400 jobs (9.2 percent) in nonmetallic mineral mining.
Arkansas California Construction Georgia Hawaii Industrial Midwest Kansas Logging Louisiana Manufacturing Michigan Mid-Atlantic states Mining Nevada New Jersey New York Oklahoma Pennsylvania South Carolina Texas

